 Material Techno-Economics
The Competitive Decarbonisation Ladder
Europe will not have enough cheap clean electricity or sustainable carbon for every route. The Investment Booster should fund each green MWh and each tonne of renewable carbon where it creates the most value, and only where it passes the competitiveness test.
A real step forward
We welcome the Investment Booster: €30bn of ETS resources mobilised fast, a simple fixed premium paid only on verified tonnes through a mechanism already proven for aviation, a solidarity ring-fence for lower-income Member States, infrastructure costs covered, a preference for clusters, and no hydrogen for medium-temperature heat. Our principles aim to help it deliver on its own goals: competitiveness and resilience.
Pay for what creates most value, not what arrives first
1. Rank before the queue. Rank each use case once, in the Terms and Conditions, on four currencies: cost, carbon abated, value created and water used. Set envelopes by rung, keep first-come-first-served within each, review the ranking every year and let routes graduate from the Innovation Fund.
| 2. Pillar | How support is paid | Key condition |
|---|---|---|
| Electrification & clean heat (incl. hydrogen) | Premium indexed to the power-to-gas price ratio; CAPEX support where the gap is small | Clean power for low-abatement routes |
| Circular renewable carbon (waste, bio, CO₂) | Premium per tonne of fossil carbon displaced, product-level MRV | Sustainable feedstock and demand |
| CCS for unavoidable emissions | Premium per tonne, also indexed to the power price | CO₂ transport and storage, in clusters |
| 3. Tier | Use cases |
|---|---|
| Fund first | Industrial heat pumps and site heat in chemical plants; circular materials; scrap-based steel; cement and lime CCS in CO₂ clusters |
| With conditions | E-glass and high-temperature heat; e-cracking and electric boilers (clean power); H₂-DRI steel (clean power below ~€80–100/MWh); cracker CCS; chemical recycling and gasification; bio-based chemicals |
| Last rung | Electrolytic hydrogen on grid power, e-methanol, e-SAF and maritime e-fuels: import the molecules, keep conversion in the EU |
4. Close the demand side with lead markets: renewable and low-carbon content in public procurement, a renewable-carbon quota for chemicals, product labels. 5. Allocate risks fairly: stop the clock for grid and CO₂-network delays, penalise project failure rather than power-price exposure, pooled guarantees for SMEs, an optional cash route for allowances.
Seven principles
- Speed is not competitivenessFirst come, first served rewards whoever queues first. Without a competitiveness test before the queue, the Booster can fund projects that close when the premium ends and never scale. Its goal is competitiveness and resilience.
- Price the electronFor electrification and hydrogen the gap is OPEX, not only CAPEX. A premium fixed in euros cannot close a gap that moves with the power bill.
- Highest value per green MWh firstThe same MWh abates three to four times more CO₂ in a heat pump than in hydrogen, and up to six times more than in e-fuels.
- Carbon where it is irreplaceableElectrons where they can do the job; renewable carbon where it stays in the product.
- Fund the first rungs, import the lastHeat pumps, circular materials, scrap and CCS for cement first. Hydrogen derivatives and e-fuels on the last rung, or imported as molecules.
- One ladder across ETS1 and ETS2Industry, buildings and road transport compete for the same green electrons and renewable carbon.
- A model, not a queueSet premia with a transparent multi-region techno-economic model, reviewed every year as routes climb the ladder.
What should change in the design
- Envelopes by rung, first come first served within them, with caps per project and per sector.
- An electricity-indexed premium, or a link to PPAs and two-sided contracts for difference, plus network-tariff relief for flexible load.
- Clean power for low-abatement electrification: e-cracking, electric boilers and high-temperature resistive heat avoid only 0.16–0.3 tCO₂ per MWh, less than the German (0.35) or Italian (0.31) grid emits. Require renewable or nuclear PPAs, or hourly-matched guarantees of origin. Heat pumps (0.6–0.7) abate more than any EU grid emits.
- A competitiveness test: supported assets viable against CBAM-adjusted imports once support ends.
- Three pillars instead of four columns: electrification and clean heat (hydrogen included), renewable carbon and circular materials, and CCS for unavoidable emissions.
- Penalties for project failure, not for power-price exposure: no penalty for flexing down in price spikes.
- Fair infrastructure risk: stop the 30-month clock for grid and CO₂-network delays; pooled or EIB-backed bonds for SMEs.
- An optional cash route: the Commission or the EIB monetises allowances and pays the guaranteed euro value.
- A graduation path: innovative routes move from the Innovation Fund into the Booster once they cross their competitive point.
Sixteen use cases, ranked by value per green MWh
Rungs at the top should be tackled first. Ratio = electricity price ÷ (gas price + carbon cost).
| # | Use case | System | Electrification & clean heat | Renewable carbon & circular | CCS | tCO₂ per green MWh | Competitive point | Resilience gain |
|---|---|---|---|---|---|---|---|---|
| 1 | Industrial process heat up to 400°C | ETS1 | Heat pumps; e-boilers + storage | — | — | 0.6–0.7 | Ratio <2.5–3 | Gas imports, energy demand |
| 2 | Heating in buildings | ETS2 | Heat pumps; district heating | Biomethane: better used elsewhere | — | 0.6–0.7 | Ratio <2.5–3, helped by ETS2 | Gas and heating-oil imports |
| 3 | Process heat in small industry | ETS2 | Heat pumps; e-boilers + storage | — | — | 0.6–0.7 | As row 1, with ETS2 | Gas imports |
| 4 | Road freight | ETS2 | E-trucks and charging hubs | Biofuels: last rung | — | ~0.6 | Cost parity on high-mileage routes | Oil imports |
| 5 | Passenger cars and vans | ETS2 | Battery-electric vehicles | Biofuels: last rung | — | 0.7–0.8 | Cost parity in many segments | Oil imports |
| 6 | Glass and ceramics | ETS1 | Electric and hybrid melting | Cullet, substitute materials | Process emissions | ~0.35 | Cullet now; melting: ratio <1.7 | Gas imports |
| 7 | Cement and lime | ETS1 | E-LEILAC (Innovation Fund) | Substitute clinker and materials | Oxyfuel or post-combustion CCS, in CO₂ clusters, low-power capture | n/a | Substitutes and CCS in CO₂ clusters | Substitutes and CCS |
| 8 | Olefins and aromatics | ETS1 | Site heat: heat pumps, e-boilers E-cracking: with conditions | Recycled and bio feedstocks | CCS on unavoidable emissions: with conditions | 0.6–0.7 site heat; ~0.2 e-cracking | Recycled-content demand; CCS and e-cracking need cheaper power | Naphtha and gas imports |
| 9 | Waste incineration | ETS1 | — | — | CCS; biogenic share as removals | n/a | CO₂ network + removal value | None on energy |
| 10 | Industrial process heat above 400°C | ETS1 | Resistive, plasma, storage; nuclear, geothermal | — | — | 0.2–0.3 | Ratio <1.5 | Gas imports, high power use |
| 11 | Primary steel | ETS1 | H₂-DRI + EAF with clean power <€80–100/MWh; else imported green HBI | Scrap-based EAF | NG-DRI + CCS (bridge) | 0.4–0.5, highest of the H₂ routes | Scrap now; H₂-DRI: clean power <€80–100/MWh (Nordics today) | Scrap: high |
| 12 | Methanol | ETS1 | e-methanol: import or Innovation Fund | Bio-methanol; biogenic CO₂ | — | ~0.1 | Bio: feedstock cost | Bio: medium |
| 13 | Aviation and maritime fuels | ETS1 | e-fuels: import or sub-mandate | Advanced biofuels | — | 0.1–0.15 | ReFuelEU and FuelEU mandates | Oil imports |
| 14 | Hydrogen | ETS1 | Electrolysis for feedstock H₂ | — | Blue H₂ (SMR/ATR + CCS) | 0.15–0.2 | Power <€20–30, or import | Low in Europe |
| 15 | Ammonia | ETS1 | RFNBO: import or off-grid | — | ATR + CCS | ~0.2 | Power <€20–30; keep EU conversion | Low in Europe |
| 16 | Aluminium and non-ferrous | ETS1 | Already electrified | — | Anode emissions (Innovation Fund) | — | Power price itself | Depends on power price |
Why the Ladder and the Booster ranking can differ. The Ladder asks where scarce green electrons create most value; the Booster pays per tonne abated. Cement CCS stays green because process emissions have no electric alternative and capture can run on kiln waste heat. Cracker CCS is conditional because the same electron abates more in site heat. Today the Decarbonisation Bank has no prioritisation model: the Ladder offers one.
What €1bn of Booster support buys
Two price cases: today (gas ~€80–88/MWh, carbon ~€88/t, industrial power ~€203/MWh) and gas normalised at €35/MWh.
| Route | Gap today €/t | Gap, gas €35 €/t | CO₂ per €1bn, gas €35, Mt | Gas displaced per €1bn, bcm |
|---|---|---|---|---|
| Industrial heat pumps (COP 2–3) | <20, often none | ~80–240 | ~4–13 | ~2–6 |
| Circular materials and substitutes | low, often none | low | high | energy and feedstock |
| CCS on cement and lime process emissions | ~10–70 | ~10–70 | ~15–100 | none, adds energy |
| High-temperature electrification | ~240 | ~460 | ~2 | ~1 |
| E-cracking | ~520 | ~740 | ~1.3 | ~0.6 |
| Electrolytic hydrogen replacing grey | ~860 | ~1,080 | ~0.9 | ~0.4 |
Illustrative, order of magnitude. Gap = levelised cost of the low-carbon route minus the fossil reference including carbon, per tonne abated; ten-year contracts; capital at 8% over 15 years; CCS at €100–160 per tonne captured and stored. Each rung has a finite potential: the ladder fills the first rungs before climbing. CCS is cheap per tonne but displaces no imported energy: essential for process emissions, not a resilience lever.
How many of the 39 rungs are competitive
Rungs that accelerate at today's prices, out of 39 processes across electrification, renewable carbon and industrial biotech, from the Ladder Lab.
Europe today: 15 of 39 rungs accelerate at an average €203/MWh power and €85/t carbon. At €40/MWh, 30 do. The binding variable of European decarbonisation is the price of the electron.
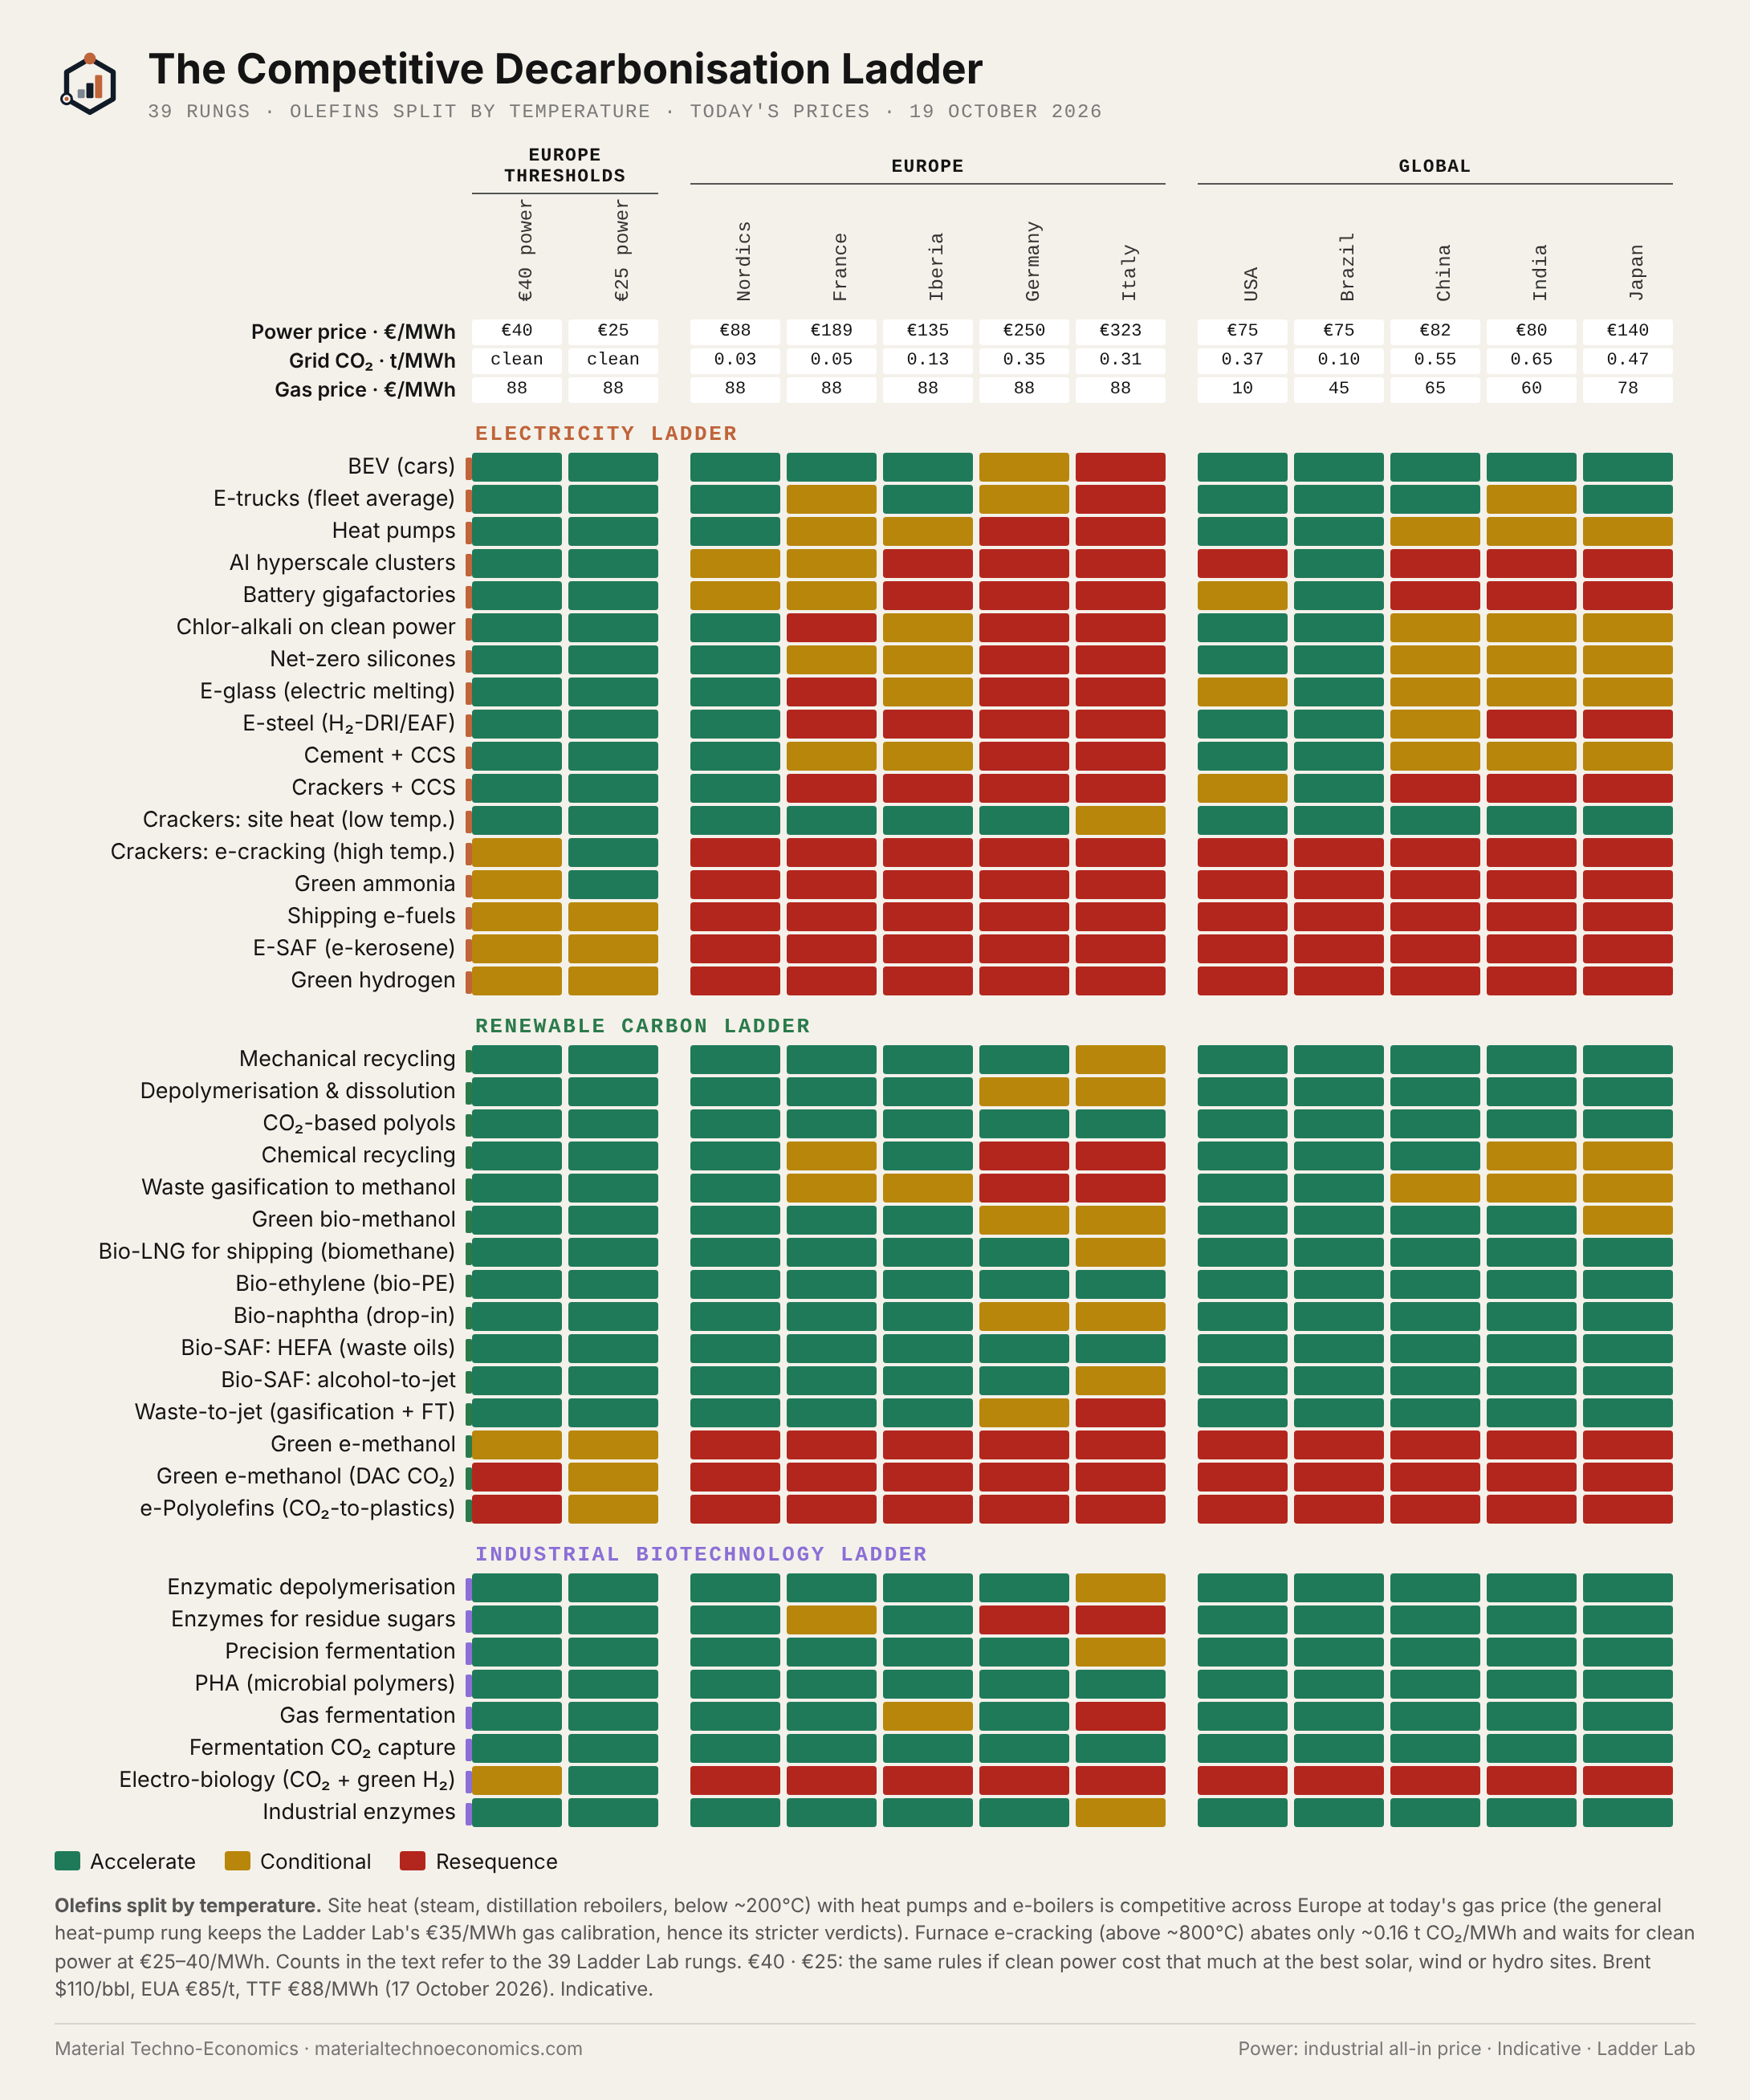
On today's trend EU emissions fall 77% by 2050 versus 1990; with all ladders maximised, 82%. Open the Ladder Lab →
Material Techno-Economics' full response is submitted to DG CLIMA through the post-event survey. Figures are indicative engineering estimates, to be calibrated with our multi-region techno-economic model. Contact: rcv@materialtechnoeconomics.com